Part 2 – How to leverage constant monitoring and in-field analysis
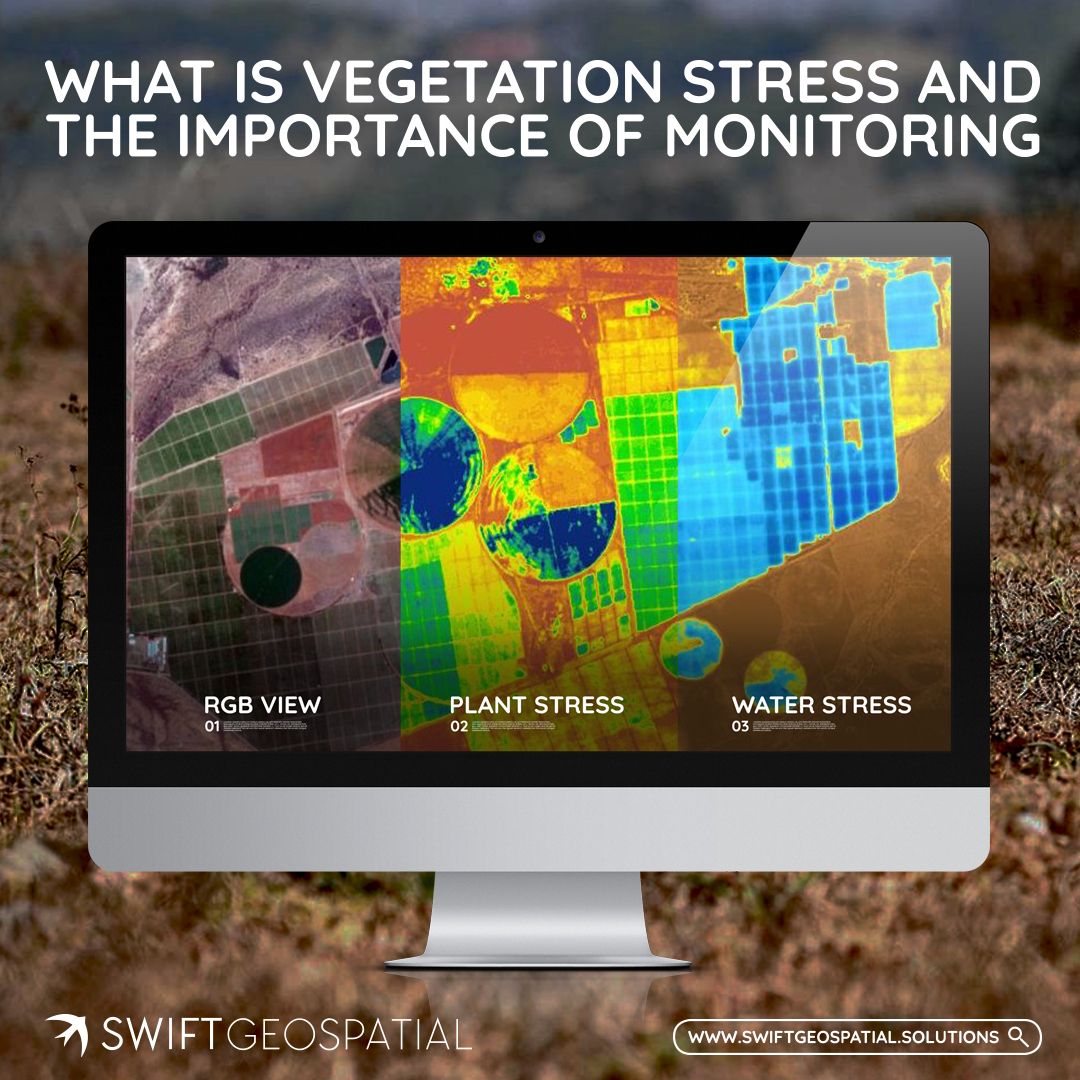
The ability to not only monitor in-field stress but also to try and predict where the stress might spread has always been a key piece of information for any forestry manager or farmer. By leveraging Planet’s satellite fleet it has become possible to monitor your plantation or farm daily, weekly or monthly (Please visit our Vegetation Monitoring Series Blog Part 1 – What is Vegetation Stress and the Importance of Monitoring for more detail). Having the insight to stop a potential threat damaging your assets will result in overall improved management.
Swift Geospatial has developed an in-field stress detection analysis as an add-on to the average compartment/field based stress detection solution already available to provide this insight.
How it works
The analysis looks at the vegetation health (NDVI values in this case) inside your field, pivot or forest compartment over time (daily, weekly, monthly etc.,).

Week-on-Week varying NDVI within a field/compartment
When vegetation heath is monitored over time, a trend of areas with constant high, or constant low values can be depicted and classified as either hot spots (areas with high NDVI values) or cold spots (areas with low NDVI values) or areas that have NDVI values falling with the compartments average. Thus, the week-on-week NDVI example given above then looks like this:

Week-on-Week varying Hot and Cold spots within a field/compartment
Areas with anomalous results are then much easier to pick up and this assists management to have a more targeted approach on where to send fieldworkers to determine the cause of the anomaly before it becomes a bigger issue. An example would be the area in the field below which would on average show a very high NDVI average field value and thus not flag as a problem field.

Field level in-field analysis
In forestry this insight can be taken a step further by monitoring the health of individual young trees. This will be covered in more detail in Part 3 of this blog series.
Up next…
Part 3 – Tree-count and In-field health analysis of young trees before canopy closure
Sign Up to Download Our Joint Webinar With Planet And Learn How Satellite Imagery is Solving Forest Management Challenges.

Click the button below to read Part 1 – What is Vegetation Stress and the Importance of Monitoring